

Real estate investing is all about determining the risk and seeking to minimize it. There is always risk in this work. If there wasn’t then we wouldn’t make any money. Each of us has to figure out our own risk tolerance. If the risk tolerance is zero, then you should stick to your employer-prescribed 401(k) and be happy. At least until you retire 😉
When we consider purchasing an investment property, we rarely start making money right away. Usually, there are repairs and other value-adds to do and to take out money immediately would affect the bottom line. More importantly, high-performers don’t need the money right now; they are willing to wait for later. Which is why predicting what will happen later is so important. We need to have multiple exit strategies for each deal. Here’s a possible scenario:
You buy a multifamily building for $1 million. You hope to raise the rents over the course of 5 to 10 years and keep the expenses to a 3% year over year growth. After 5 years you plan to double the NOI. By year 10, you plan to triple it. That will mean that the property value will be either doubled or tripled depending on the time. But, to realize that value, you have to sell the property. When you sell, you are going to value the place based on the NOI and the cap rate. The cap rate goes up or down with the market and has an effect on the value. Higher cap rates mean lower values. When you sell, you want a low cap rate. But, you don’t know what the cap rate will be 5 or 10 years from now. You might have an idea, but you don’t know. If the cap rate is too high, you might not be able to sell for what you predicted, and you might lose money. That’s risk. And thinking about this is a sensitivity analysis.
The Sensitivity Analysis
At its heart, it’s just a consideration of how much the deal can take as a certain metric changes. It might be the cap rate in our example, or it might be expenses going up more than you predicted, or not raising the rents as high. It’s going to compare this metric with some outcome measure, usually income over the life of the deal. The IRR is a good one for this. Click that link to learn about it. If you can’t be bothered to do that, the IRR is a percentage that your deal has to be above to make it worthwhile. It’s not, but you can think of it as an inflation-adjusted return over the life of the deal.
If you were extra nerdy, you could even create a sensitivity table.
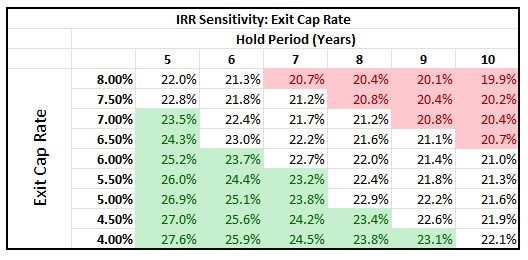
But, I’m certainly not that nerdy, so I don’t often do this. Though I might to show to investors. In the table, we have decided that we want an IRR of at least 21%, which is higher than I usually need in my deals. In this example, anything lower than 23% is neutral (white), lower than 21% is bad (red), and higher than 23% is good (green).
This table is telling me that for this hypothetical deal, I would need to sell at a cap rate of 7% or lower at year 5 and could not wait until year 10 to sell, because I don’t think the cap rate will ever drop below 4%. Due to money losing value over time (read the IRR series on time value of money to understand this, I implore you), the gains you get in increased rent and appreciation are outpaced by inflation and risk.
If we look at this chart longer, just before our eyes cross, we can see that lower cap rates have higher IRRs. But, we don’t really think we will be able to sell at a cap rate of 4%, right? Maybe we looked back at the sales in our area over the past 20 years and the cap rate has always fluctuated between 4.5% and 7.5%. We might assume we will be able to sell in that range. This chart is telling me that we need to sell earlier in the deal to make best use of our money. We don’t actually have to do that, but as we go on farther in the deal, we need to have different exit strategies.
Perhaps we will never sell and pass it to our children. Maybe we will convert the building into an office. Or demolish it and build self-storage units. As time goes on, we have to be willing to consider these things. That’s really what we are doing with the sensitivity analysis. It’s just another tool in the bag we have when evaluating deals. Try it on your next deal.
